
|
Understanding Duodenal Atresia: Causes, Symptoms, and Treatment Duodenal atresia is a rare congenital condition that affects the development of the duodenum, the first part of the small intestine. It is a congenital intestinal obstruction awhich occurs when the duodenum is either completely blocked or narrowed, leading to problems with digestion and nutrient absorption. Let's talk about the causes, symptoms, and treatment options for duodenal atresia. Causes: Duodenal atresia is believed to be a result of abnormal development during the early stages of fetal growth. While the exact cause is unknown, several factors may contribute to its occurrence. These include genetic abnormalities, maternal diabetes, certain genetic syndromes such as Down syndrome, and exposure to certain medications during pregnancy. Symptoms: Duodenal atresia typically becomes apparent soon after birth. Some common symptoms after birth include:
Diagnosis: Duodenal atresia is typically diagnosed shortly after birth. However, it can be identified on prenatal ultrasound. Ultrasound findings include:
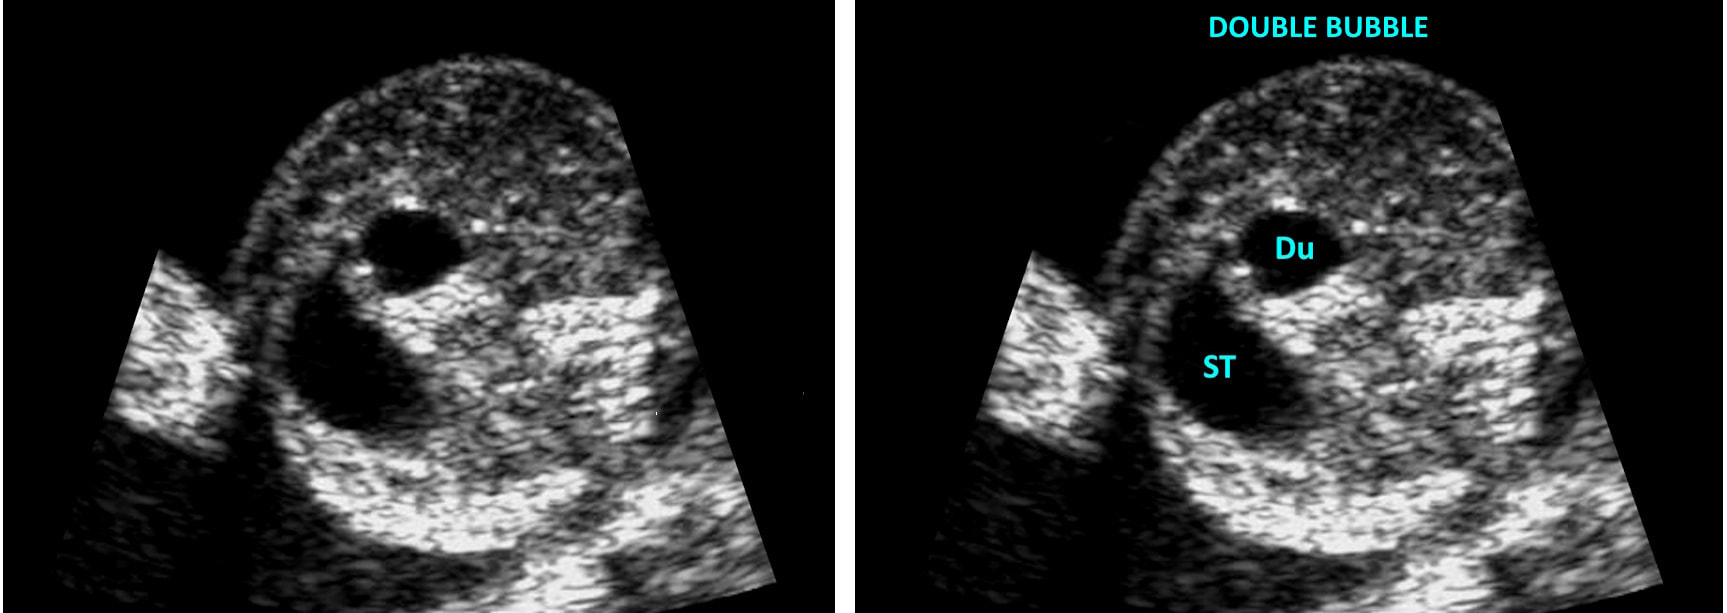
It is important to note that these ultrasound findings are suggestive of duodenal atresia, but they are not definitive. Additional diagnostic tests, such as genetic testing and fetal karyotyping, may be required for a confirmed diagnosis. Also, neonatal testing such as ultrasound and x-ray imaging can be helpful to diagnose and evaluate the severity.
Treatment: The primary treatment for duodenal atresia is surgery. The surgical procedure involves bypassing or removing the obstructed portion of the duodenum and connecting the healthy segments. The specific surgical approach depends on the severity of the condition.
Following surgery, infants will require close monitoring in a neonatal intensive care unit (NICU) to ensure their digestive system functions properly. They may receive nutrition through intravenous fluids until they are able to tolerate oral feeding. Prognosis: With timely diagnosis and appropriate surgical intervention, the outlook for infants with duodenal atresia is generally favorable. After surgery, most infants can resume normal feeding and achieve healthy growth and development. However, it is essential for parents and caregivers to follow up with regular medical check-ups to monitor the child's progress and ensure there are no long-term complications related to the surgery. With proper treatment and ongoing medical care, children with duodenal atresia can go on to lead healthy and fulfilling lives.
0 Comments
Sonography is a profession that involves hands-on patient care and often can place our bodies in difficult positions with strain on our backs, shoulders, necks, wrists and hands. Unfortunately, sonographers are at risk of developing musculoskeletal injuries and disorders due to the nature of our work. However, there are several ways to prevent these injuries:
By following these tips, we as sonographers can reduce the risk of musculoskeletal injuries and disorders, maintain a healthy work-life balance and prolong our careers.
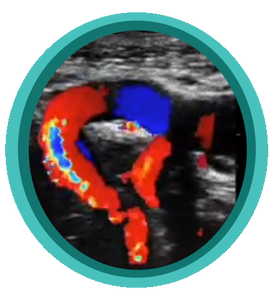
Quick Tips - Ultrasound Physics Doppler ShiftWhat is the arrow in the image referencing? You guessed it! Zero Doppler Shift - Let's talk about why. The Doppler effect or Doppler shift is the change in frequency of a wave in relation to an observer who is moving relative to the wave source. It is named after the Austrian physicist Christian Doppler, who described the phenomenon in 1842. In Color ultrasound the Doppler shift works with the ultrasound system to fill in color within the vessel when there are frequency changes in relation to the observer (transducer). When the direction of the sound beam is perpendicular to the direction of flow. There is no appreciable Doppler Shift and no color filling as a result. This is due to the cosine of the angle being 90 degrees.  Studying for your ultrasound registry exam? We can help! Our online ultrasound registry review course and Test & Learn Review Quiz can help you level up and pass your ultrasound registry exam today!
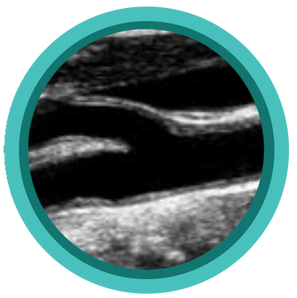
Quick Tips - GYN Ultrasound ANATOMY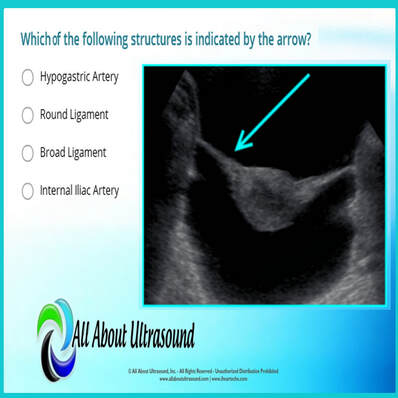 Which of the following structures is indicated by the arrow? Test your ultrasound anatomy skills!
You guessed it! This image is referring to the Broad Ligament. The broad ligament is a two-layered fold of peritoneum that extends from the sides of the uterus to the floor and lateral walls of the pelvis inferiorly and the adnexa superiorly. The broad ligament helps to hold the uterus in its anatomic position. It covers the uterus, ovaries, and fallopian tubes and also includes nerves and blood vessels to these organs. In this ultrasound image, the reason the broad ligament is easily identified is because of the fluid filling the pelvis. This highlights the location of the broad ligament. In normal settings, without a large amount of free fluid or the presence of other pathology, the broad ligament is rarely recognized on ultrasound. Studying for your OB/GYN ultrasound registry exam? Study with us! LEARN MORE Quick Ultrasound Physics Registry Review Tips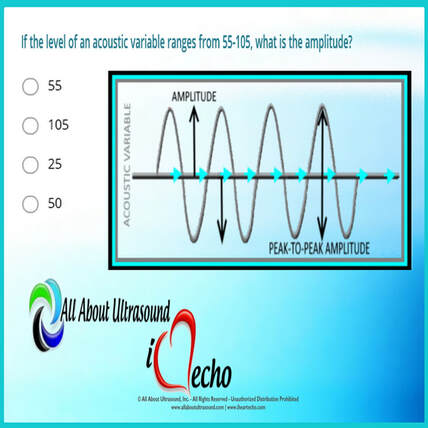 If the level of an acoustic variable ranges from 55-105, what is the amplitude? You guessed it! The answer is 25. But why? The amplitude is calculated by determining the median between the range values and then calculating the difference between the median and high/low values of the range. Amplitude is the amount of change in an acoustic variable. Amplitude is equal to the difference between average and the maximum or minimum values of an acoustic variable (or half the “peak-to-peak” amplitude). In the example in the question, the median of the range is 80. 80 is 25 above 55 and 25 below 105 - therefore the amplitude is equal to 25. The amplitude of ultrasound waves decrease as they travel through tissue, a phenomenon known as attenuation. For more info on amplitude and ultrasound physics, check out our other ultrasound physics resources. Studying for your ultrasound registry exam? We can help! Our ultrasound registry review courses and quizzes will take your ultrasound skills to the next level!
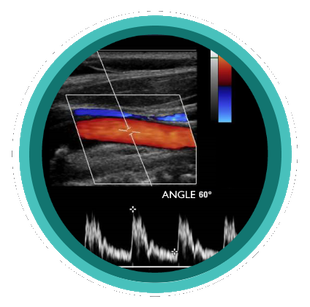
A Quick Look At Ovarian Doppler Waveforms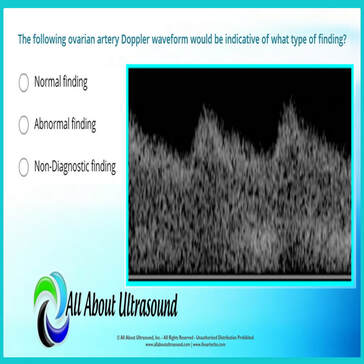 The following ovarian artery Doppler waveform would be indicative of what type of finding? The answer is ABNORMAL FINDING - but why? Let's take a quick look at the Doppler waveform and what makes it abnormal. The image reveals a low resistive waveform and is indicative of an abnormal ovarian Doppler finding. This can often be associated with Ovarian Torsion. When a blood vessel has a LOW RESISTIVE Doppler waveform appearance, this is due to the need for extra flow. Vascular beds that require a higher blood supply show these low resistive waveforms on spectral Doppler. This means that the waveform has a high diastolic component, indicating constant flow throughout diastole. This is common for vessels that supply muscles when you're working out, or the stomach and intestines when you've just eaten, or for the vessels that supply the brain and vital organs. However when a blood vessel shows LOW RESISTIVE characteristics for an organ that usually doesn't require a constant level of blood supply, this is a key marker that something isn't right and usually indicates stenosis. Blockage in the vessel will cause the vessel to become low resistive in order to compensate for the lack of flow.  Studying for your ultrasound registry exam? We can help! Our ultrasound registry review courses, quizzes will take your ultrasound skills to the next level!
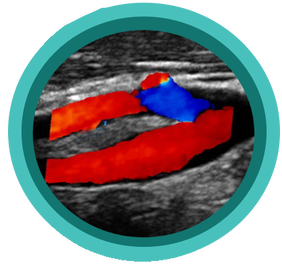
Scanning those tortuous Carotid vessels can sometimes be tricky! So here we'll go through 5 quick scanning tips to help you get great carotid images and accurate velocities.
Get Our FREE SCANNING TIP DOWNLOAD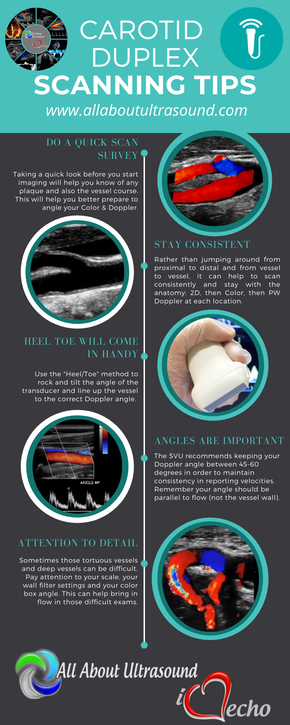 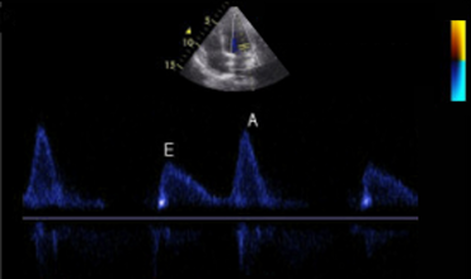 Diastology can often be confusing, as there have many updates to the standards and guidelines regarding how to assess and grade left ventricular diastology in the past few years. So let's dig in to how to assess this and the echocardiographer's role in evaluating diastology based on the updated 2016 ASE Guidelines. So as cardiac sonographers, we should all know the basics... E/A reversal = Diastolic Dysfunction, but there is a little more to it than that. If you're not fully evaluating diastology with additional measures, you're probably missing some positive cases. Also the Intersocietal Accreditation Commission now includes reporting of left ventricular diastolic function as a requirement for echocardiography accreditation. 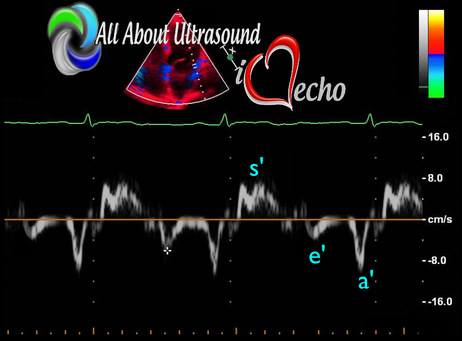 What exactly is diastolic dysfunction? This is a decrease in left ventricular compliance during diastole. While the ejection fraction and left ventricular systolic function are needless to say, pretty important, the diastolic function of the heart is important too. If the heart does not rest properly during diastole, then it cannot fill with the right amount of blood volume needed and eventually this can lead to heart failure and significant clinical implications. So it's important to know the left atrial pressures and end diastolic left ventricular pressures in order to determine the level of severity of the diastolic dysfunction. The updated guidelines break it down like this: Grade 0 = Normal Grade 1 = Impaired Relaxation/Diastolic Dysfunction Grade 2 = Pseudonormalization Grade 3 = Restrictive Pathophysiology So how do we get to the diagnosis? Based on the updated standards from the ASE, determination of normal vs diastolic dysfunction is evaluated initially, based on the patient's EF. If a patient has a normal ejection fraction then the algorithm looks at four components to determine whether or not the patient has a degree of diastolic dysfunction: 1. Average E/e’ > 14 2. e' velocity -Septal e’ velocity < 7 cm/s -Lateral e’ velocity <10 cm/s 3.TR velocity > 2.8 m/s 4. LA volume index >34ml/m2 If <50% are positive, the patient is considered normal. If >50% are positive, the patient has a degree of diastolic dysfunction. If only 50% are positive, then we are unable to determine whether the patient has diastolic dysfunction. If the patient has a compromised ejection fraction, then we can assume that there is a degree of diastolic dysfunction and can grade it based on the E/A ratio. When the mitral inflow pattern shows an E/A ratio <0.8 along with a peak E velocity of <50cm/sec, then the mean LAP is either normal or low and this is considered a Grade 1. When the mitral inflow pattern shows an E/A ratio of >2, the mean LAP is elevated, consistent with Grade 3 diastolic dysfunction. Keep in mind patients with young or athletic patients may show this ratio in the setting of normal diastolic function. Also, patients in atrial fibrillation may exhibit a reduced or loss of the mitral A wave and may also produce similar findings. For patients with reduced EF's that do not meet one of those parameters and the mitral inflow shows an E/A Ratio >0.8 AND the peak E velocity is >50 cm/sec OR E/A Ratio >8 but <2, then other parameters are required for determination of diastolic dysfunction. 1. Average E/e’ Ratio - average E/e’ ratio >14 2. TR Velocity - peak jet velocity >2.8 m/sec 3. LA Volume Index - >34 mL/m2 If 2 of 3 are negative, the patient is considered to have Grade 1 diastolic dysfunction, where if 2 of 3 are positive, then this is considered Grade 2. So, are you confused yet? Let's look at the grading parameters a little closer. GRADE 0 - NORMAL DIASTOLOGYThis means that left atrial pressures (LAP) are normal and the diastolic function is not impaired. The left ventricle relaxes normally throughout diastole and allows for complete diastolic filling. The E/A ratio in a normal setting, is between 1 and 2. This gradually reduces with age and E/A ratio >0.75 may be considered normal above 75 years. 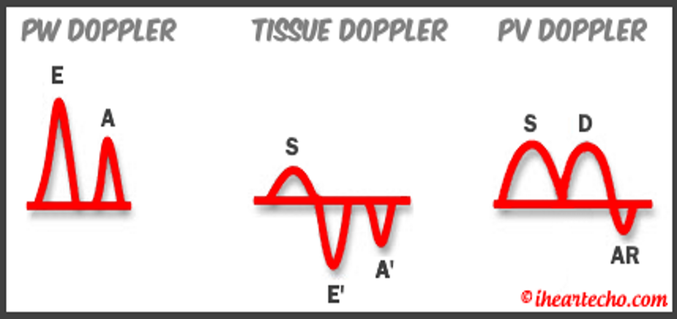 GRADE 1 - IMPAIRED RELAXATION/DIASTOLIC DYSFUNCTIONPatients that do not have a NORMAL EF, will have a degree of diastolic dysfunction and are evaluated based on filling pressures of the left atrium. Left atrial pressures can be somewhat normal in a patient with Grade 1 diastolic dysfunction, but will increased as this progresses. Patients with Grade 1 diastolic dysfunction will have reduced e' velocities and prolonged deceleration time. 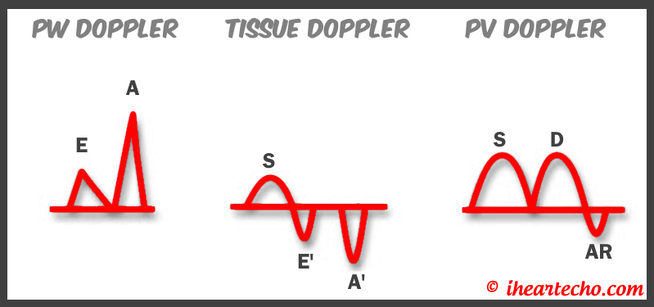 GRADE 2 - PSEUDONORMALIZATIONOne of the biggest factors that our role as sonographers requires, is knowing your patient history. This will often help you know whether or not you're dealing with a normal waveform or pseudonormalization. Granted there are some other key factors but the most obvious is whether or not the patient has previously been diagnosed with diastolic dysfunction. If they have previously had reversal of the E/A waveform and now have a normal waveform pattern, this is a pretty good indicator that the patient is in pseudonormalization. Also, keep in mind some of the other factors associated with increased left atrial pressures, such as blunting or changes to the pulmonary venous waveform, as well as reduced e' velocities. When pseudonormalization is present, the valsalva maneuver can assist to "unload" the ventricle and to reduce filling pressures, causing the E/A reversal to be unmasked.  GRADE 3 - RESTRICTIVE FILLING PATTERNGrade 3 diastolic dysfunction involves increased left atrial pressures and increased end diastolic left ventricular pressure. This may result in reversal of the pulmonary venous waveform and is often seen with the presence of left atrial enlargement and left ventricular hypertrophy.  ECHO DIASTOLOGY GRADING ANALYSIS TOOLS!The newly updated algorithm for determining diastology and left atrial pressures can be a little overwhelming and difficult to follow, but we make it easy with our Echocardiography Analysis Tools which include our exclusive LV Diastology Assessment Tool! Quickly and easily determine and grade the diastology based on the updated ASE guidelines. Also there are many other parameters that affect diastology and the application of the diagnostic criteria, such as age, athletic hearts and other factors. Learn and review these additional factors and an in depth study of diastolic dysfunction in our MASTERING LV DIASTOLOGY CME COURSE!
REFERENCE: ASE/EACVI GUIDELINES AND STANDARDS Recommendations for the Evaluation of Left Ventricular Diastolic Function by Echocardiography: An Update from the American Society of Echocardiography and the European Association of Cardiovascular Imaging; Nagueh et al
Please note: allaboutultrasound.com and iheartecho.com are not endorsed by or affiliated with the American Society of Echocardiography 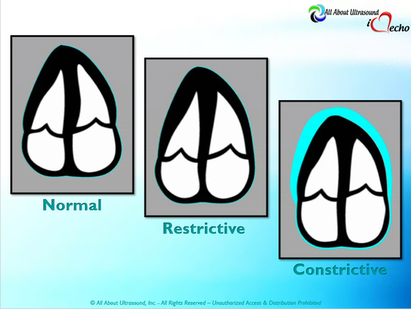 Mastering Echocardiography can be tough, especially when it comes to complex processes like Constrictive Pericarditis. Patients with Constrictive Pericarditis do not present for typical pericarditis symptoms. Instead, they present with symptoms of heart failure and so this can often be a challenge for even very skilled sonographers to identify the subtle differences between Restrictive Cardiomyopathy and Constrictive Pericarditis. These two disease processes can appear very similar on echocardiography. However, there are a few things that clue us into the correct diagnosis. 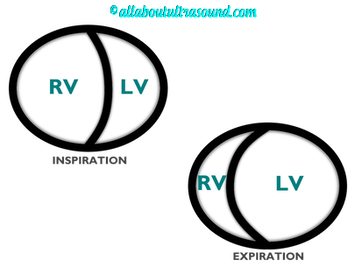 Constrictive Pericarditis is seen with a fibrotic, thickened pericardium, which insulates the ventricle and constricts the ventricle from fully relaxing during diastole. Whereas, Restrictive Cardiomyopathy results in a thickened myocardium, which inhibits the ability of the ventricle to relax and also results in abnormal diastolic function. However, that's where the similarities end. First of all, we need to evaluate for interdependence of the ventricles. But what does that mean? Ventricular interdependence is when there is a respiratory ventricular septal shift. This then leads to an increase in the volume of one ventricle associated with a decreased volume in the opposite ventricle. This can be tricky to diagnose, so it takes a pretty detailed echo exam and a keen eye of the sonographer and physician.  Secondly, when evaluating for constriction, we will need to look at respiratory changes to the Doppler waveform patterns. The respiratory changes in the Mitral inflow pattern will show a variation of greater than 15% when constriction is present. Whereas, with restriction, this waveform pattern will show a restrictive filling pattern with an E/A ratio >2.0 and deceleration time <160ms. 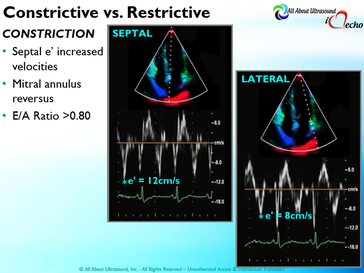 Another key factor in determining constriction vs. restriction is the E/e' ratio and diastolic function. Remember that both disease processes will have a degree of diastolic dysfunction. Normal left ventricular function will typically show a lateral e’ greater than septal/medial e' velocities, because the septal wall is somewhat restricted and the lateral wall is more free to move. However, with constriction the pericardium is insulating the ventricular movements and does not allow for full relaxation and movement of the lateral wall. This results in mitral annulus reversus, which is a decreased lateral e' velocity and compensatory increase in tissue velocities in the septal/medial annulus. Restrictive patterns in tissue velocities will show an overall decrease in both the lateral and septal e' velocities. 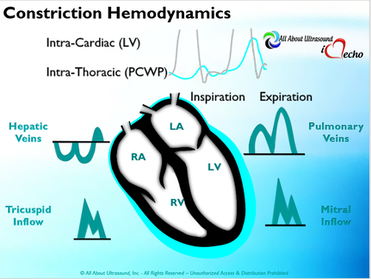 Additionally, with constriction, this will result in expiratory hepatic vein reversal. But why does this occur? Remember that air moves from areas of high pressure to low pressure, which allows for air flow into the lungs. During expiration, the volume of air (and the pressure) of the thoracic cavity decreases, causing the intrapulmonary pressure to rise above the atmospheric pressure. However, with constriction, the pericardium is insulating the intracardiac chambers and this keeps them from tracking normally with intrapulmonary pressures. Remember the pulmonary artery and aorta are OUTSIDE of the pericardium. So with constriction the thorax pressure and the pulmonary venous pressure will drop, but there are phasic filling differences within the heart, because the gradient to fill the left side of the heart is decreased. The heart is no longer able to push outward against the pericardium, so the pressure is forced inward into the cardiac chambers. So during expiration, the pressure in the right atrium causes flow reversal in the hepatic veins. Whereas, with chronic late stages of restriction, there is an inspiratory reversal during diastole, because there is no shifting of septum and the right heart cannot accommodate increased flow which results from chronic diastolic dysfunction and this causes hepatic vein reversal. While diagnosing Constrictive Pericarditis on echocardiography can certainly be a challenge, it can be done with confidence. Paying close attention to the details and recognizing when your patient with heart failure symptoms might actually be more than meets the eye, can help to make the correct diagnosis and ensure adequate treatment for your patient. Want more information on the differences between Constrictive Pericarditis and Restrictive Cardiomyopathy, including Strain Imaging methods? See our E-Learning Course Mastering Constrictive Pericarditis and earn 1 SDMS CME credit. REFERENCES
 Studying for that ARDMS or CCI ultrasound registry exam can be brutal! So we've covered this topic a few times before, but it is always helpful to revisit some of these study tips. Passing your ARDMS or CCI Ultrasound Registry exam is easier than you think.... There's no need to worry! Don't stress over it... just study. Mastering ultrasound physics or any other ultrasound specialty can be so overwhelming and often it can you make you want to give up. Don't give up! You've got this! Keep on studying and use these simple tips to study and PASS your ultrasound registry!
Hope these tips help you pass your ultrasound registry. For more help and tools to pass - check out our ultrasound registry reviews with quizzes and tools to help you master the ARDMS and CCI registries! Sign up for a FREE TRIAL (no credit card needed) of our Ultrasound Physics SPI Registry Review Course that includes our PASS GUARANTEE and pass with us!  |

Making Waves™All About Ultrasound presents Making Waves™, our ultrasound specific blog and newsletter. Join us here for ultrasound news, cases and more! Don't FORGET YOUR MERCH!
Archives
May 2023
Categories
All
|


 RSS Feed